Data visualizationLiterature2026

Salvation Atlas

An interactive atlas of a novel, built from its language
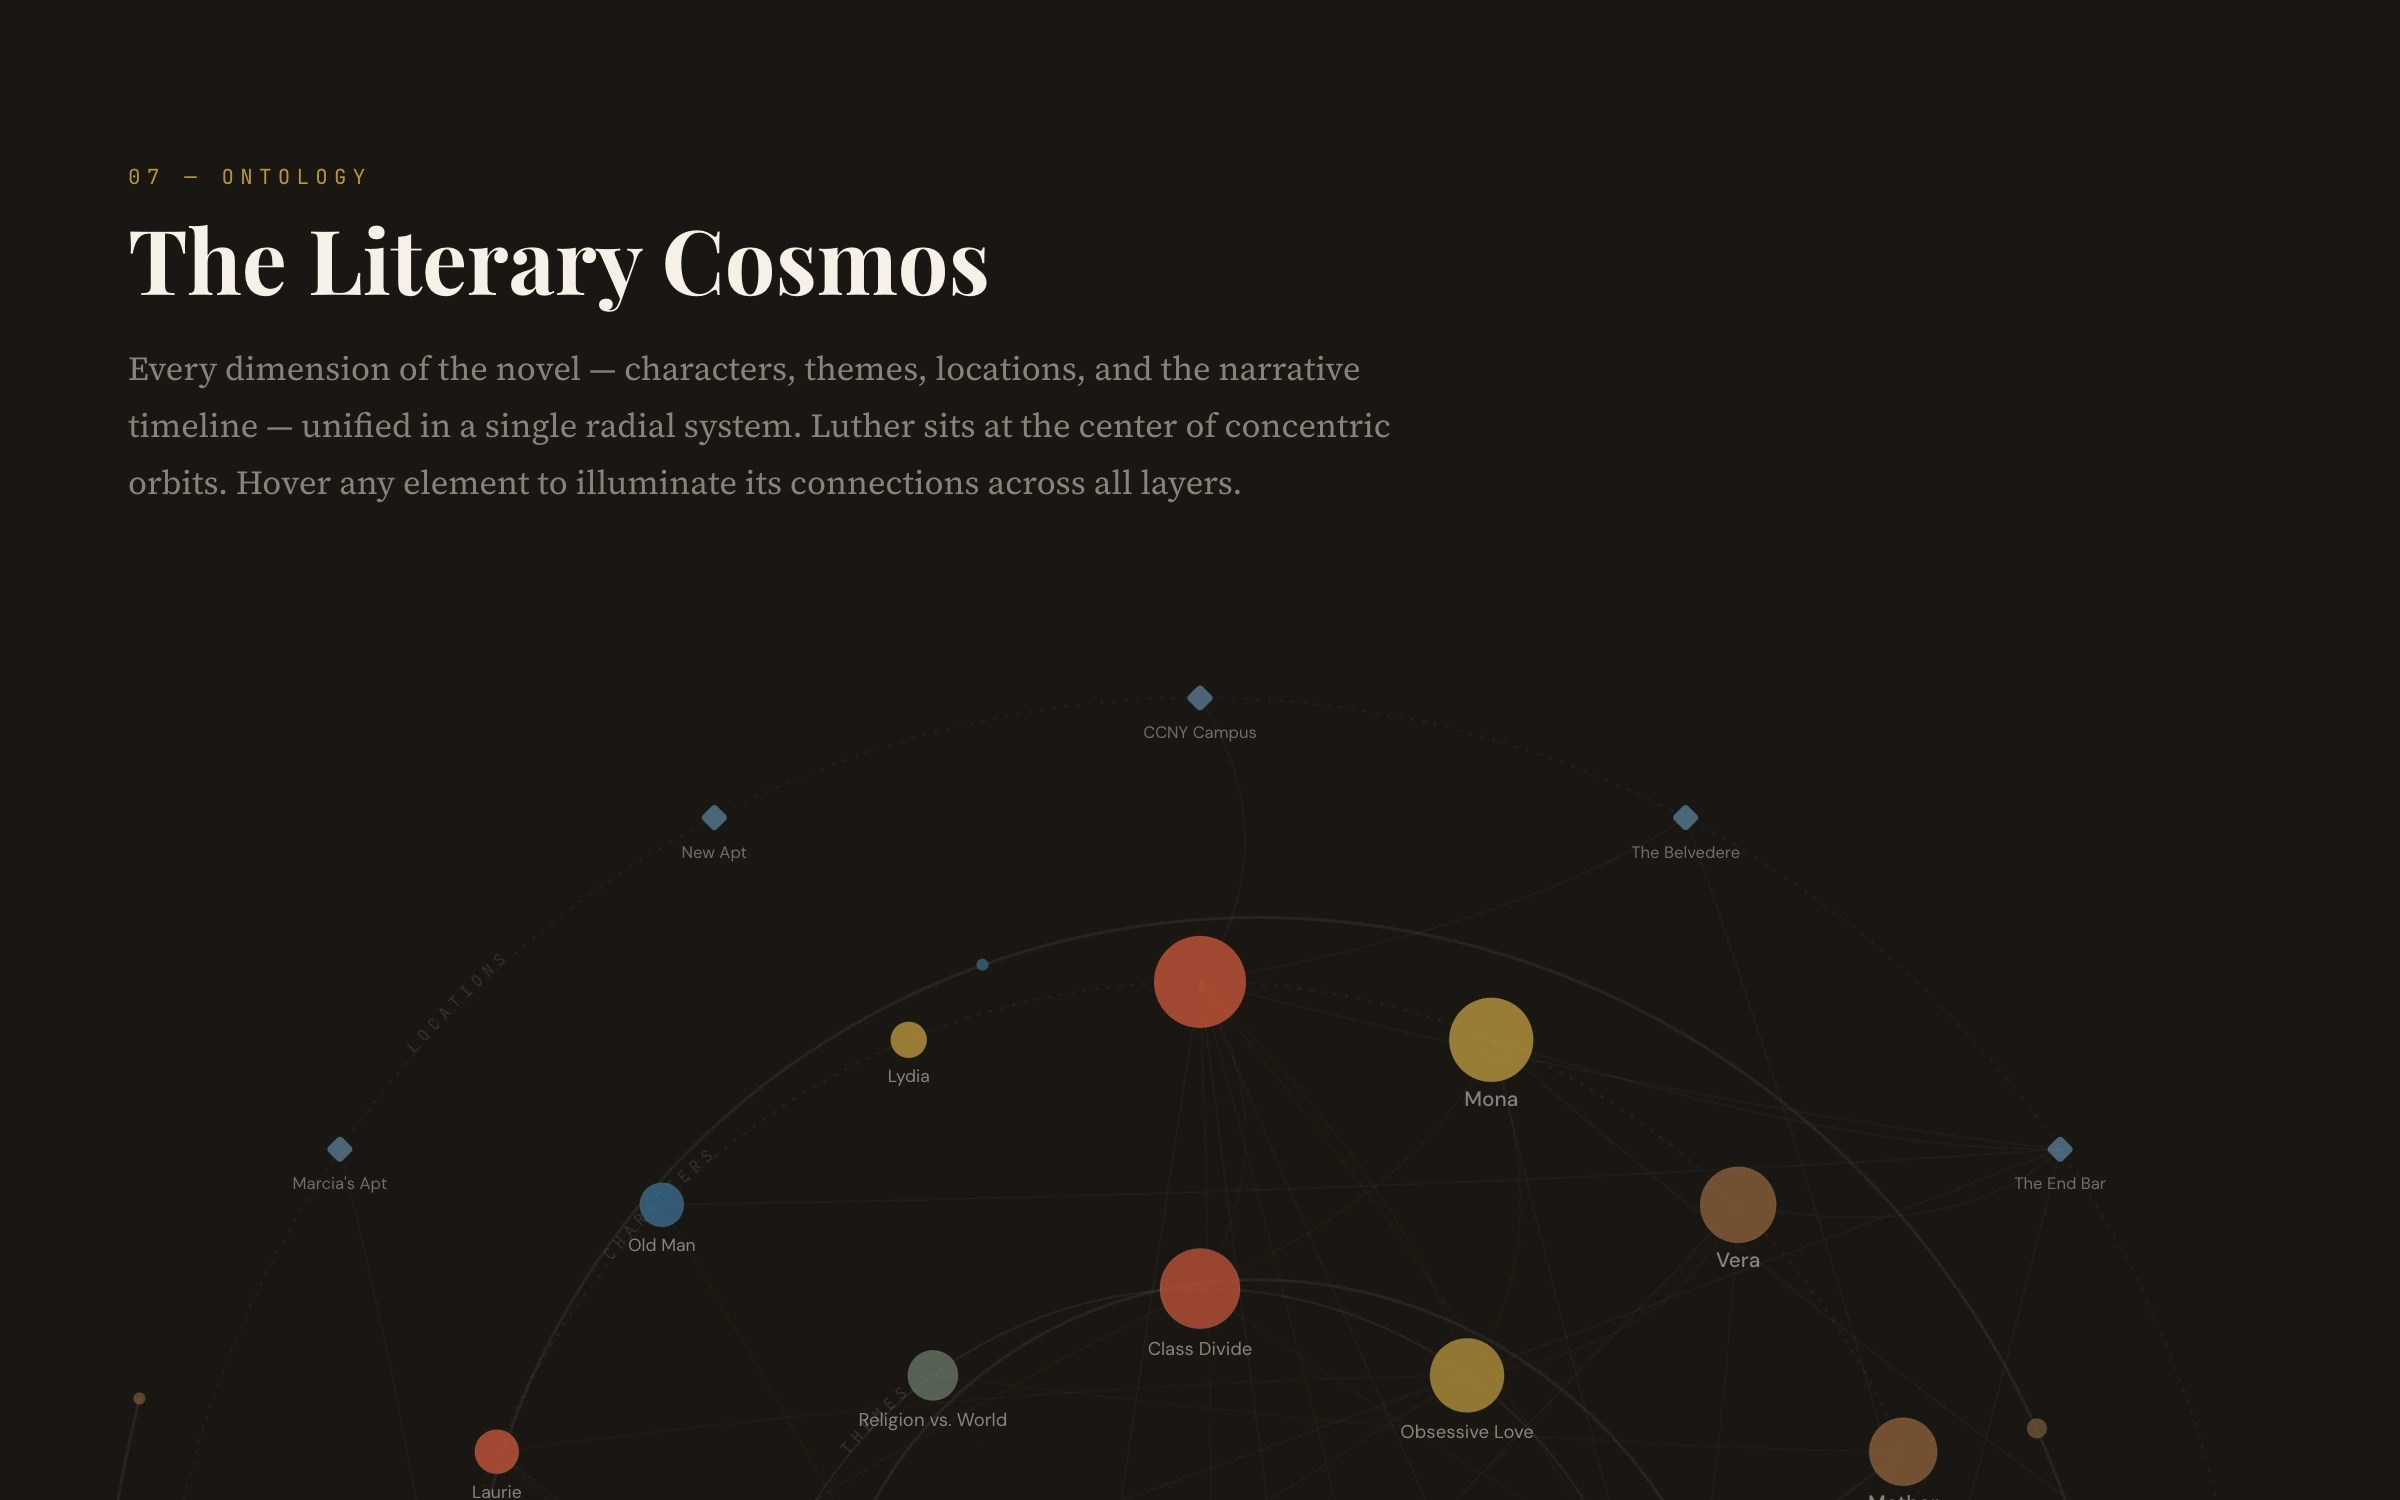
“The Literary Cosmos”: every dimension of the novel in one radial system

Salvation Atlas reads a published novel with natural language processing and semantic analysis and draws what it finds. The story’s four acts become a chart of its shape; the shifts in narrative voice become a timeline; the characters become a constellation, connected by their relationships; the themes become currents; and the book’s New York becomes a map.

Everything is drawn with D3 and reads on a phone. It is a demonstration of what data visualization can do with a text.
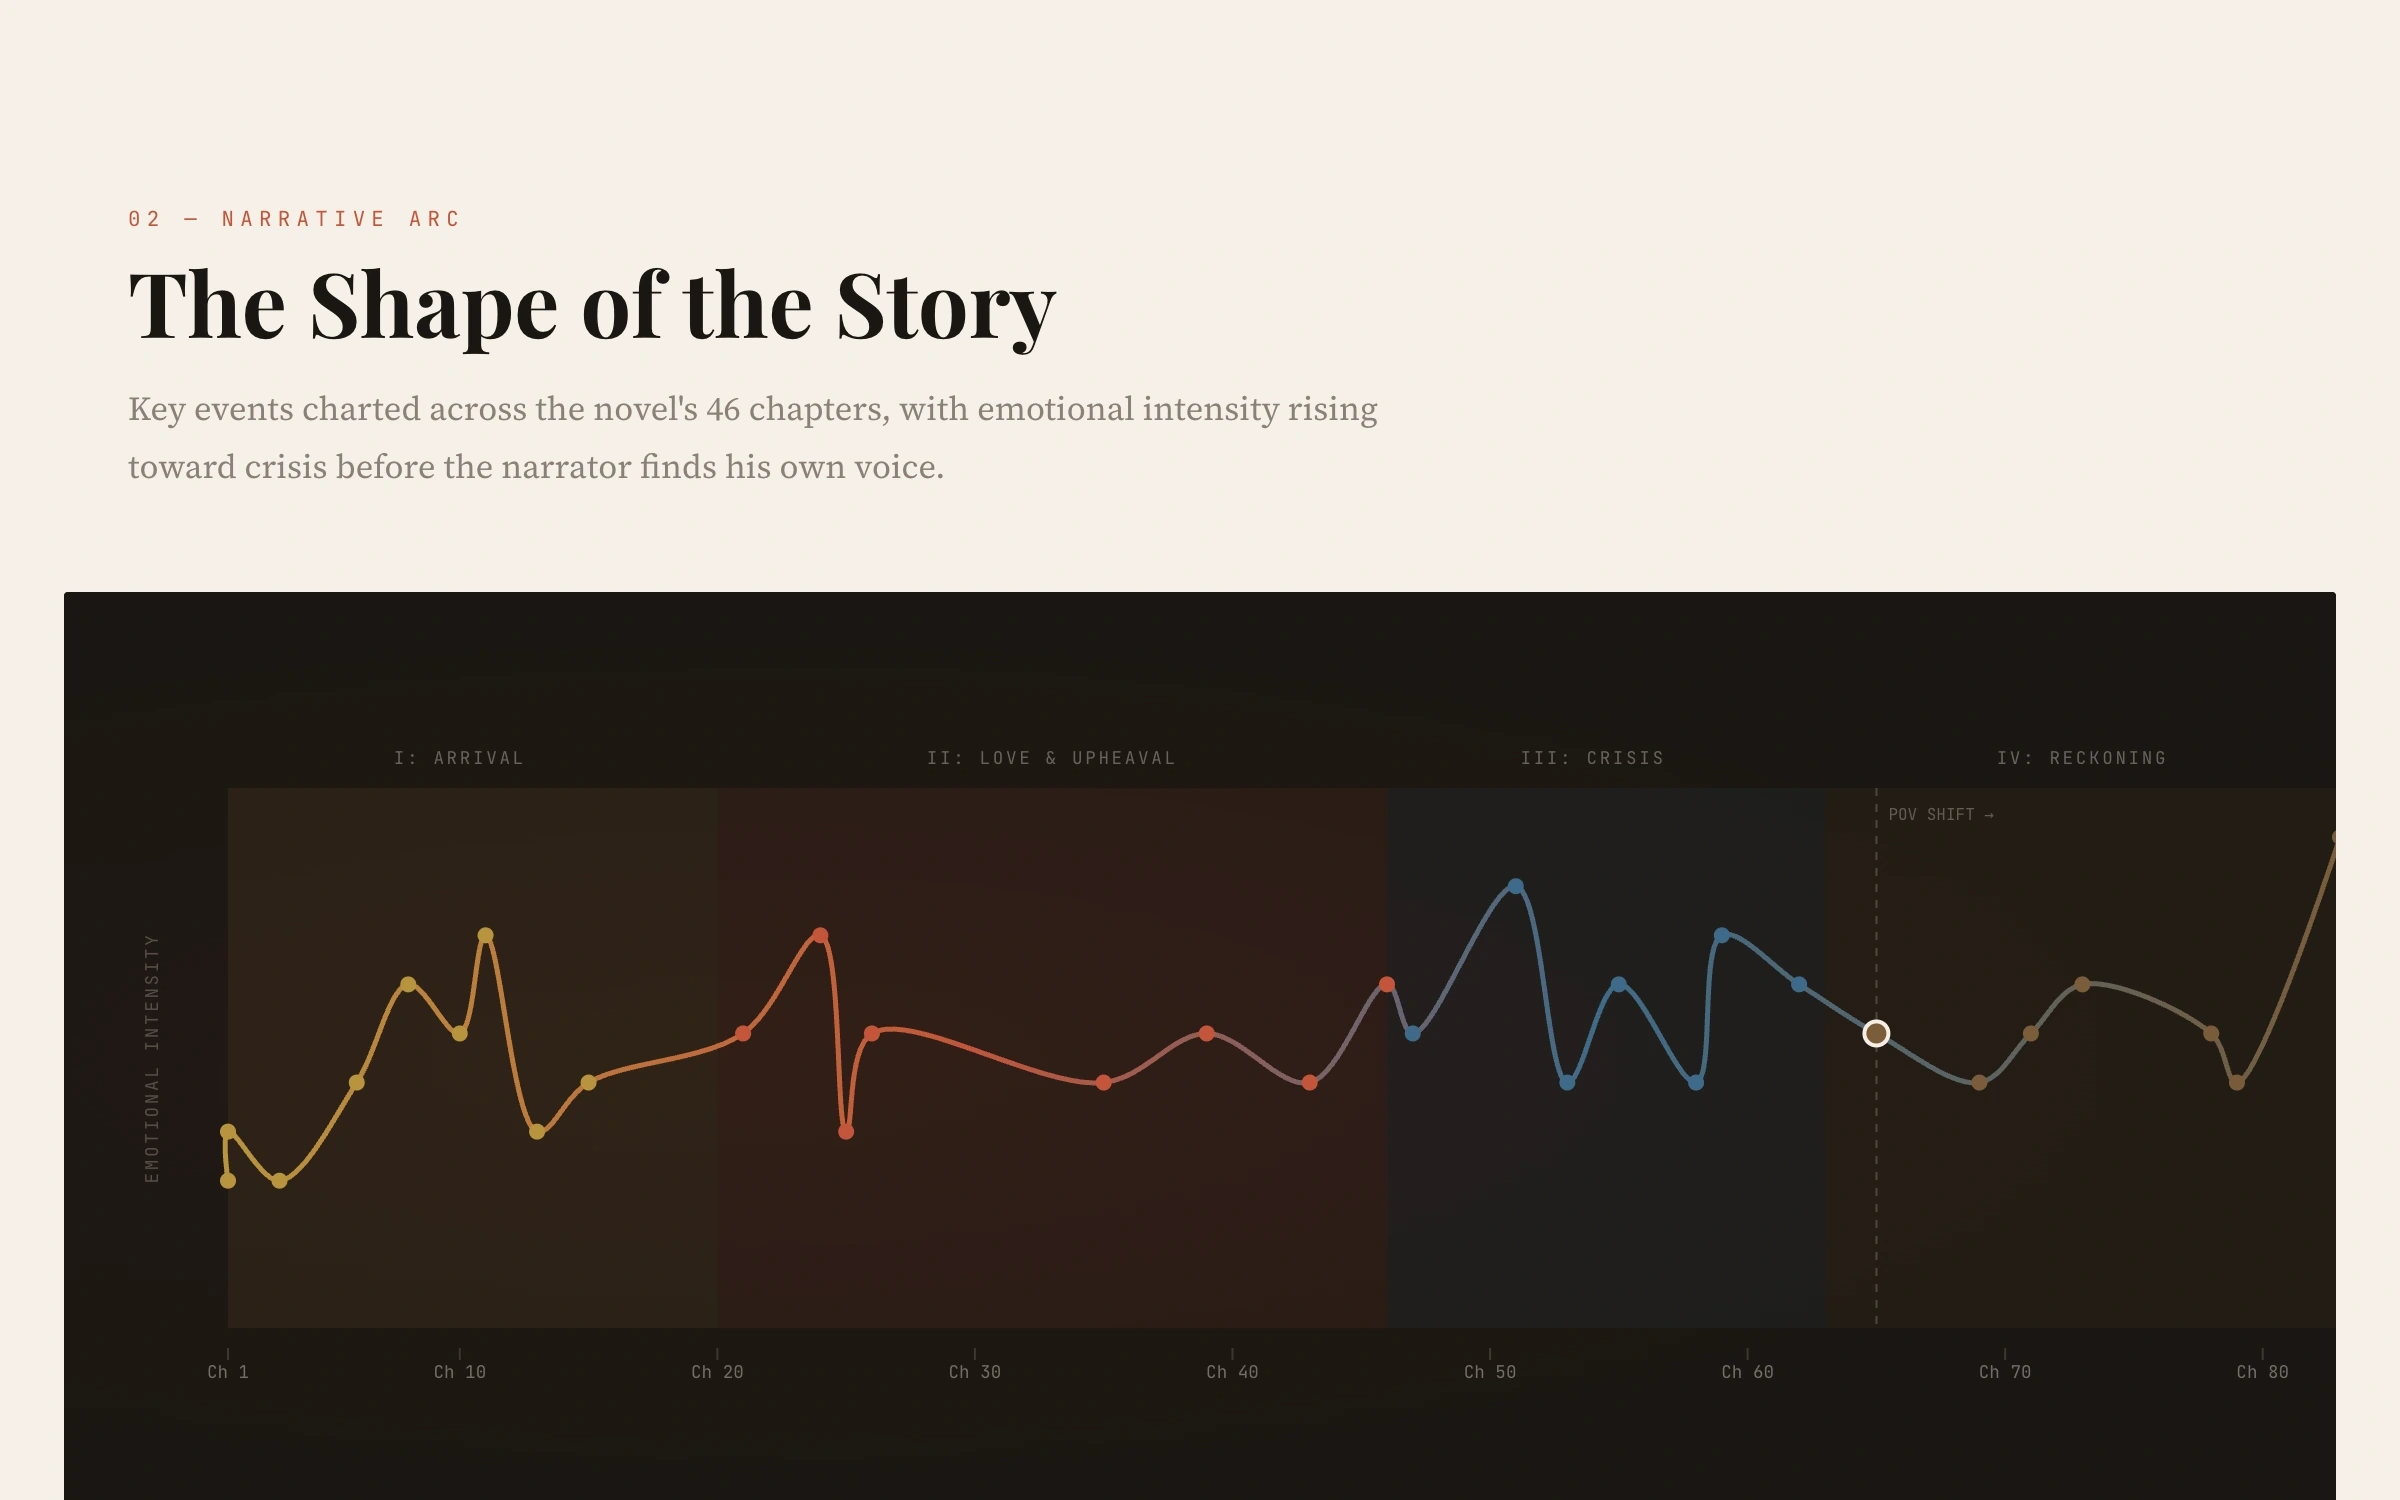
“The Shape of the Story”: a line chart of emotional intensity across the chapters
02The shape of the story, chapter by chapter.
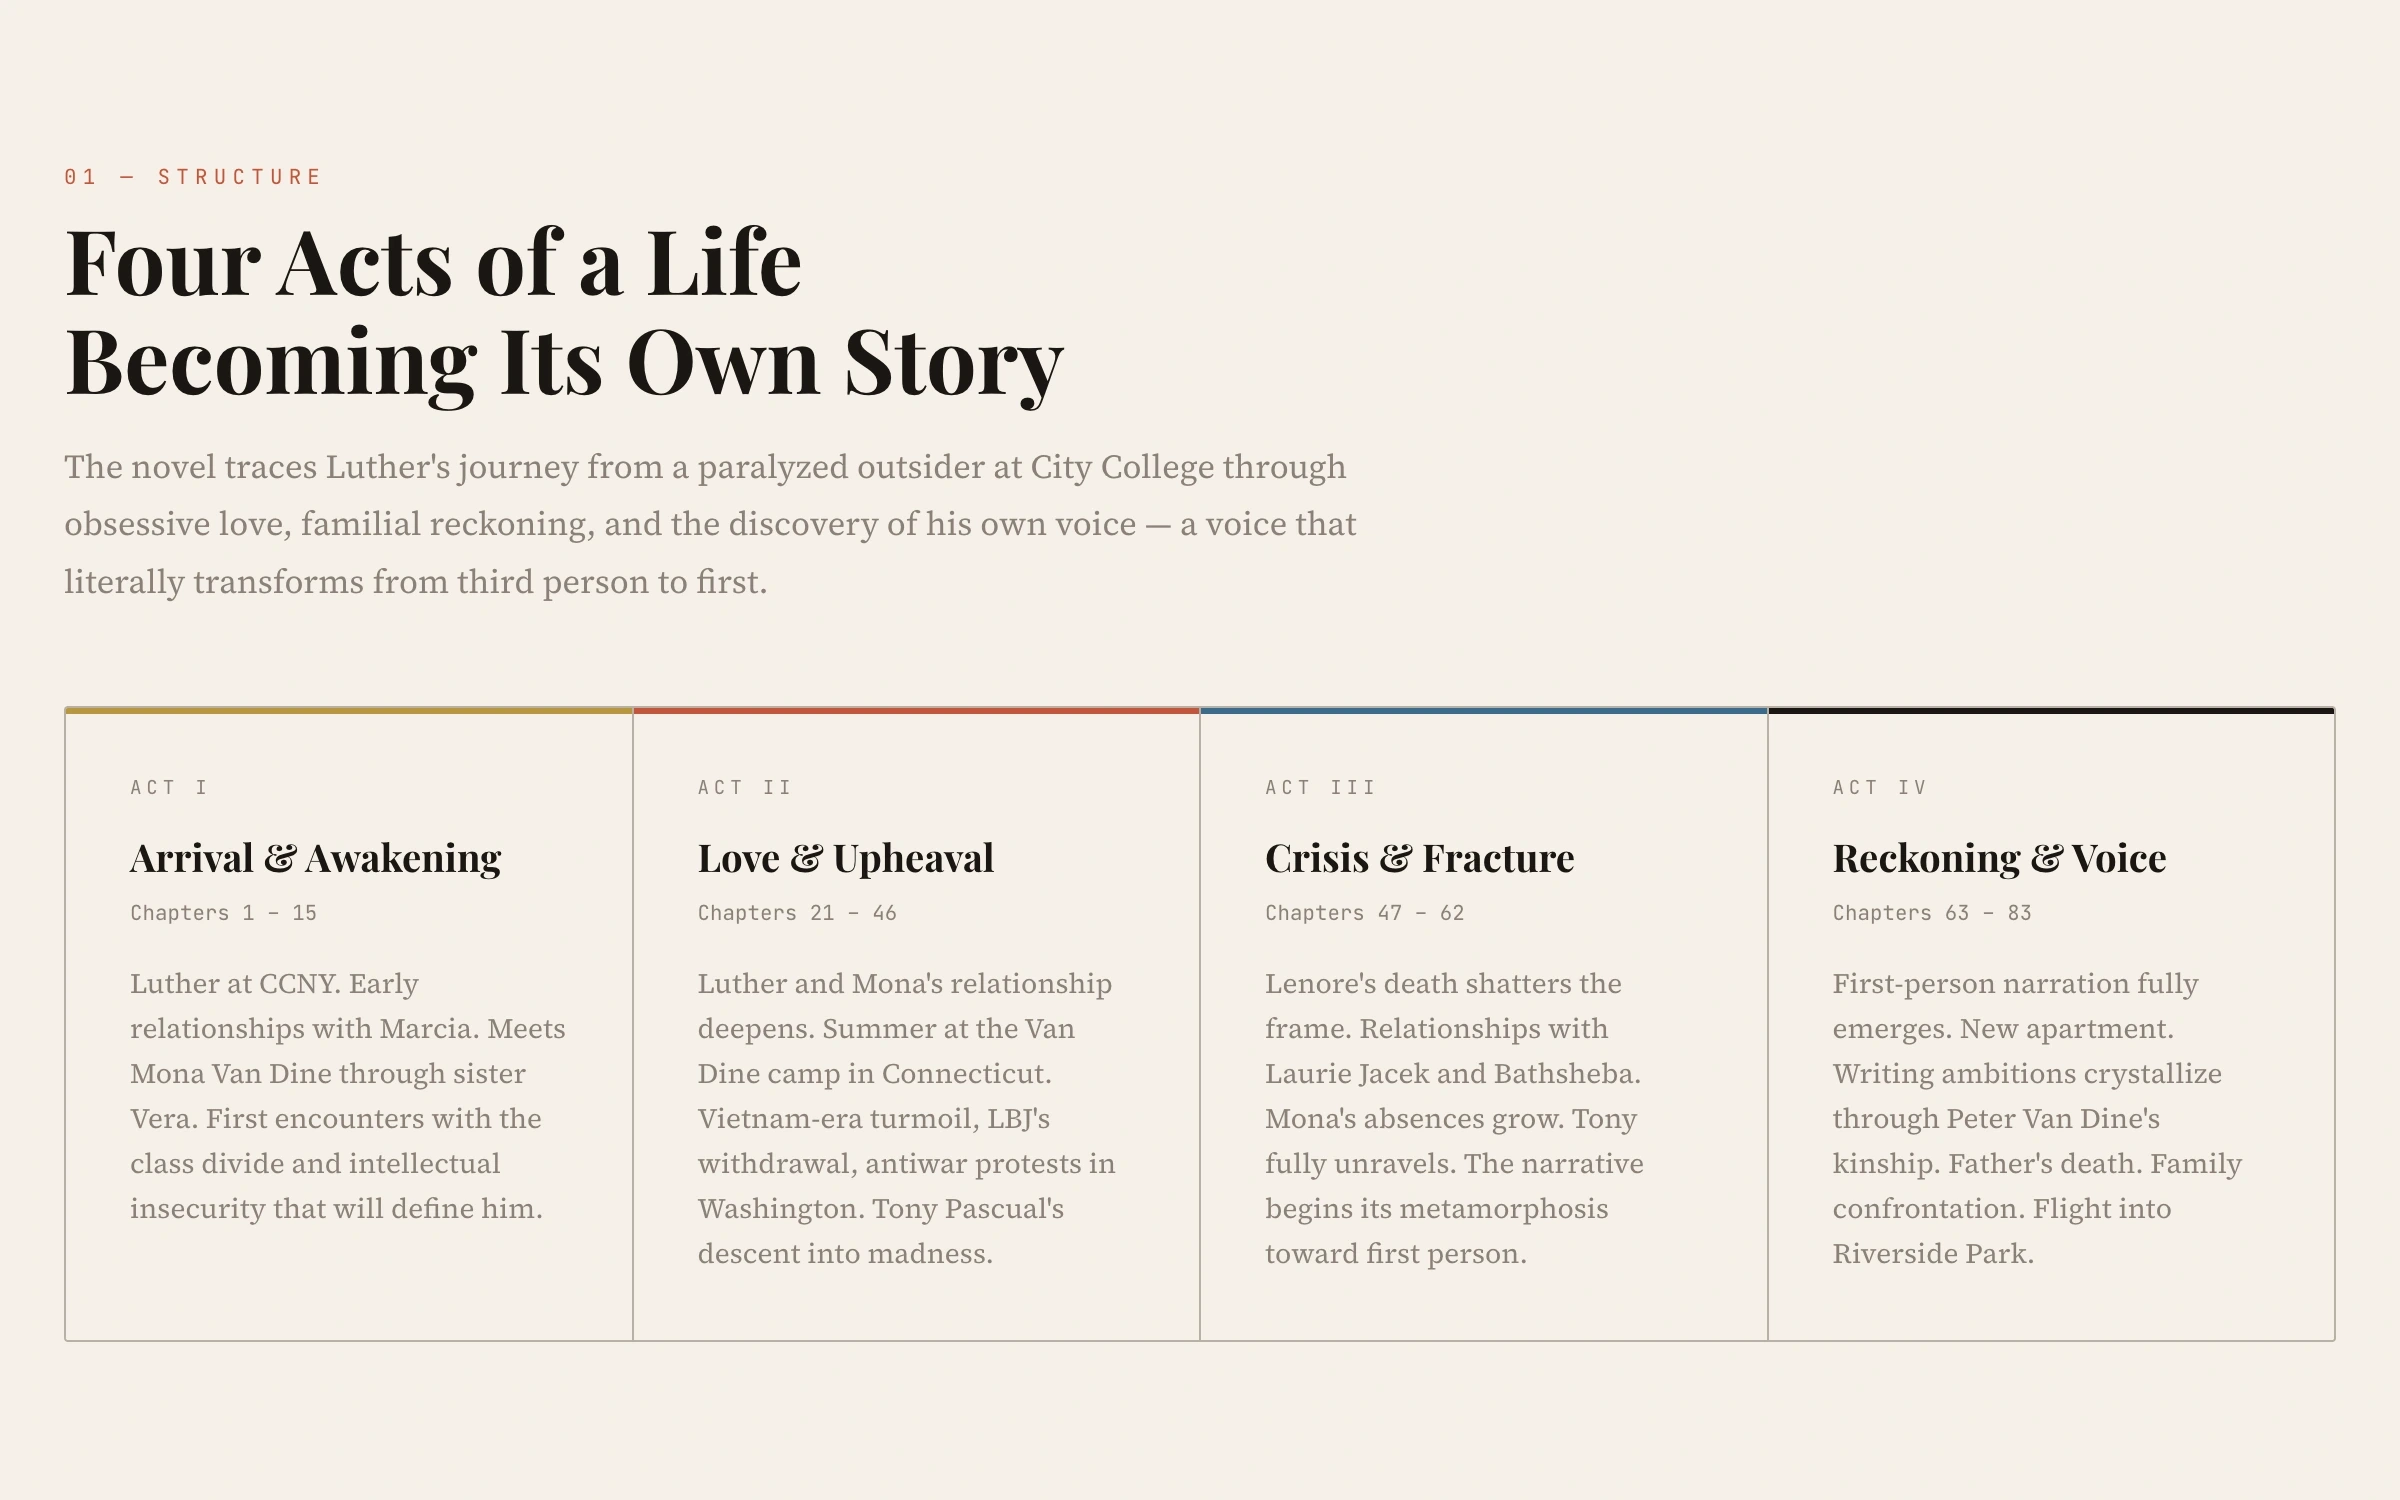
“Four Acts of a Life Becoming Its Own Story”: the novel’s structure in four columns
03The structure: four acts, each with its chapters.
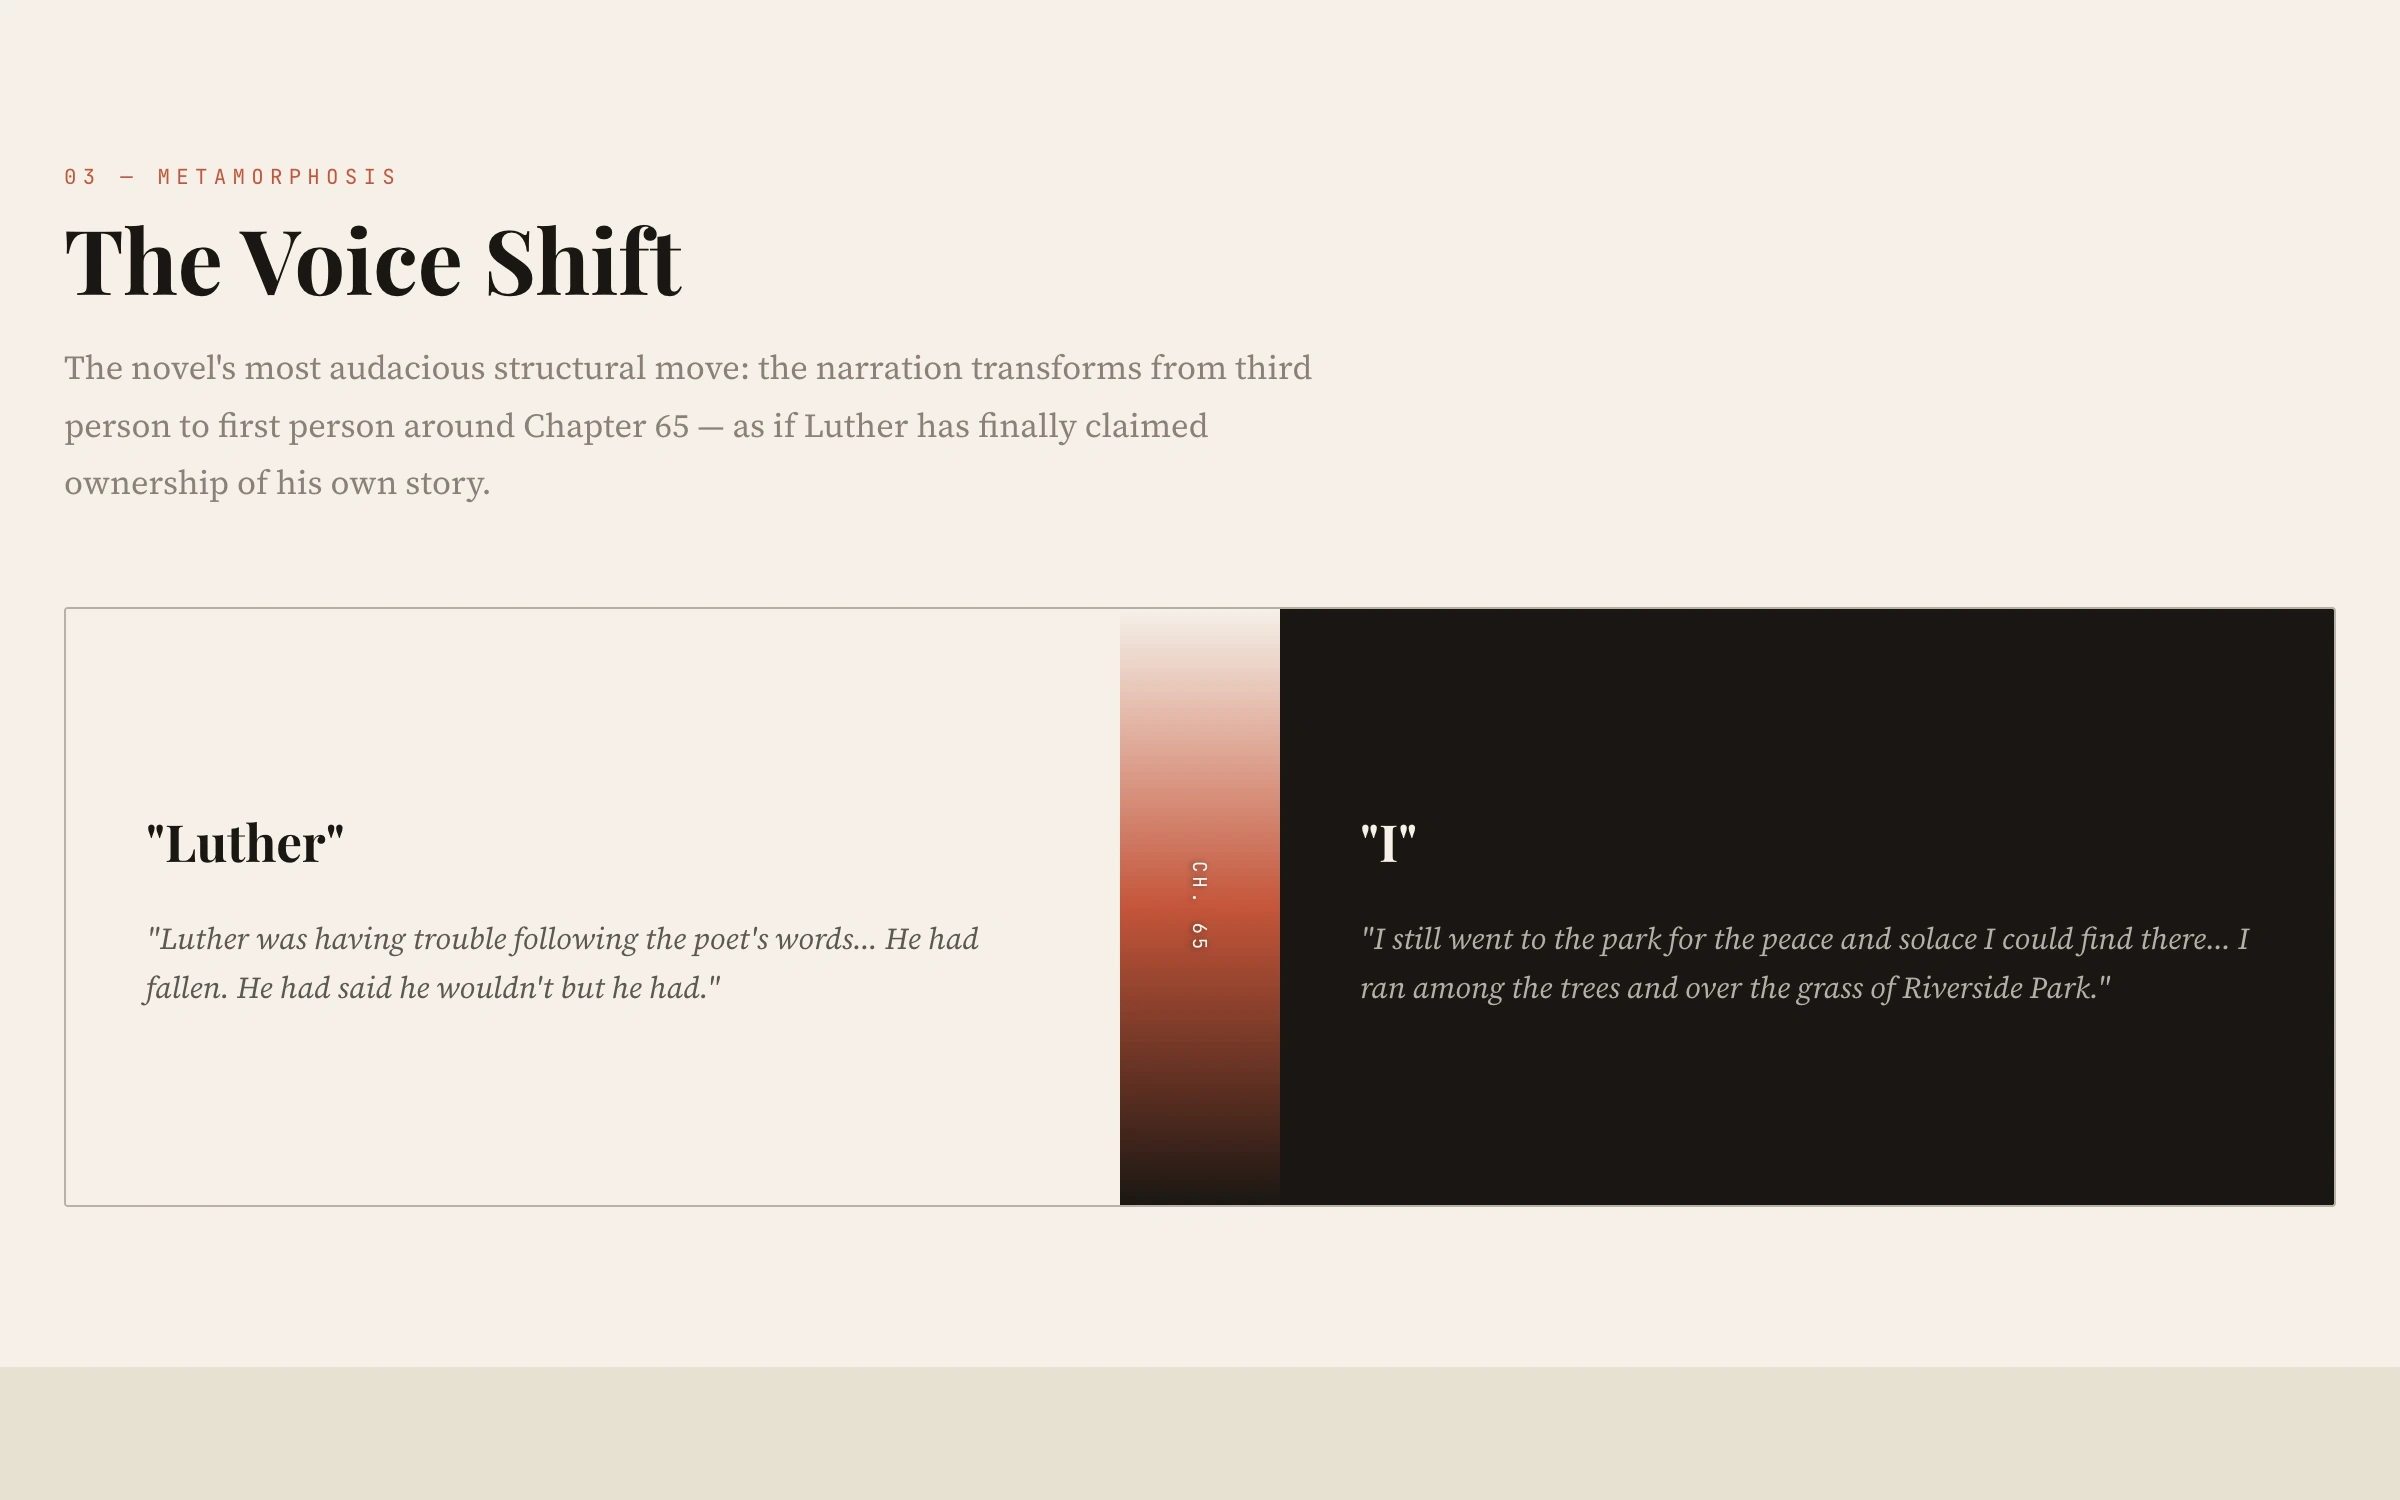
“The Voice Shift”: the narration moving from “Luther” to “I”
04The voice shift: where the narration moves from third person to first.
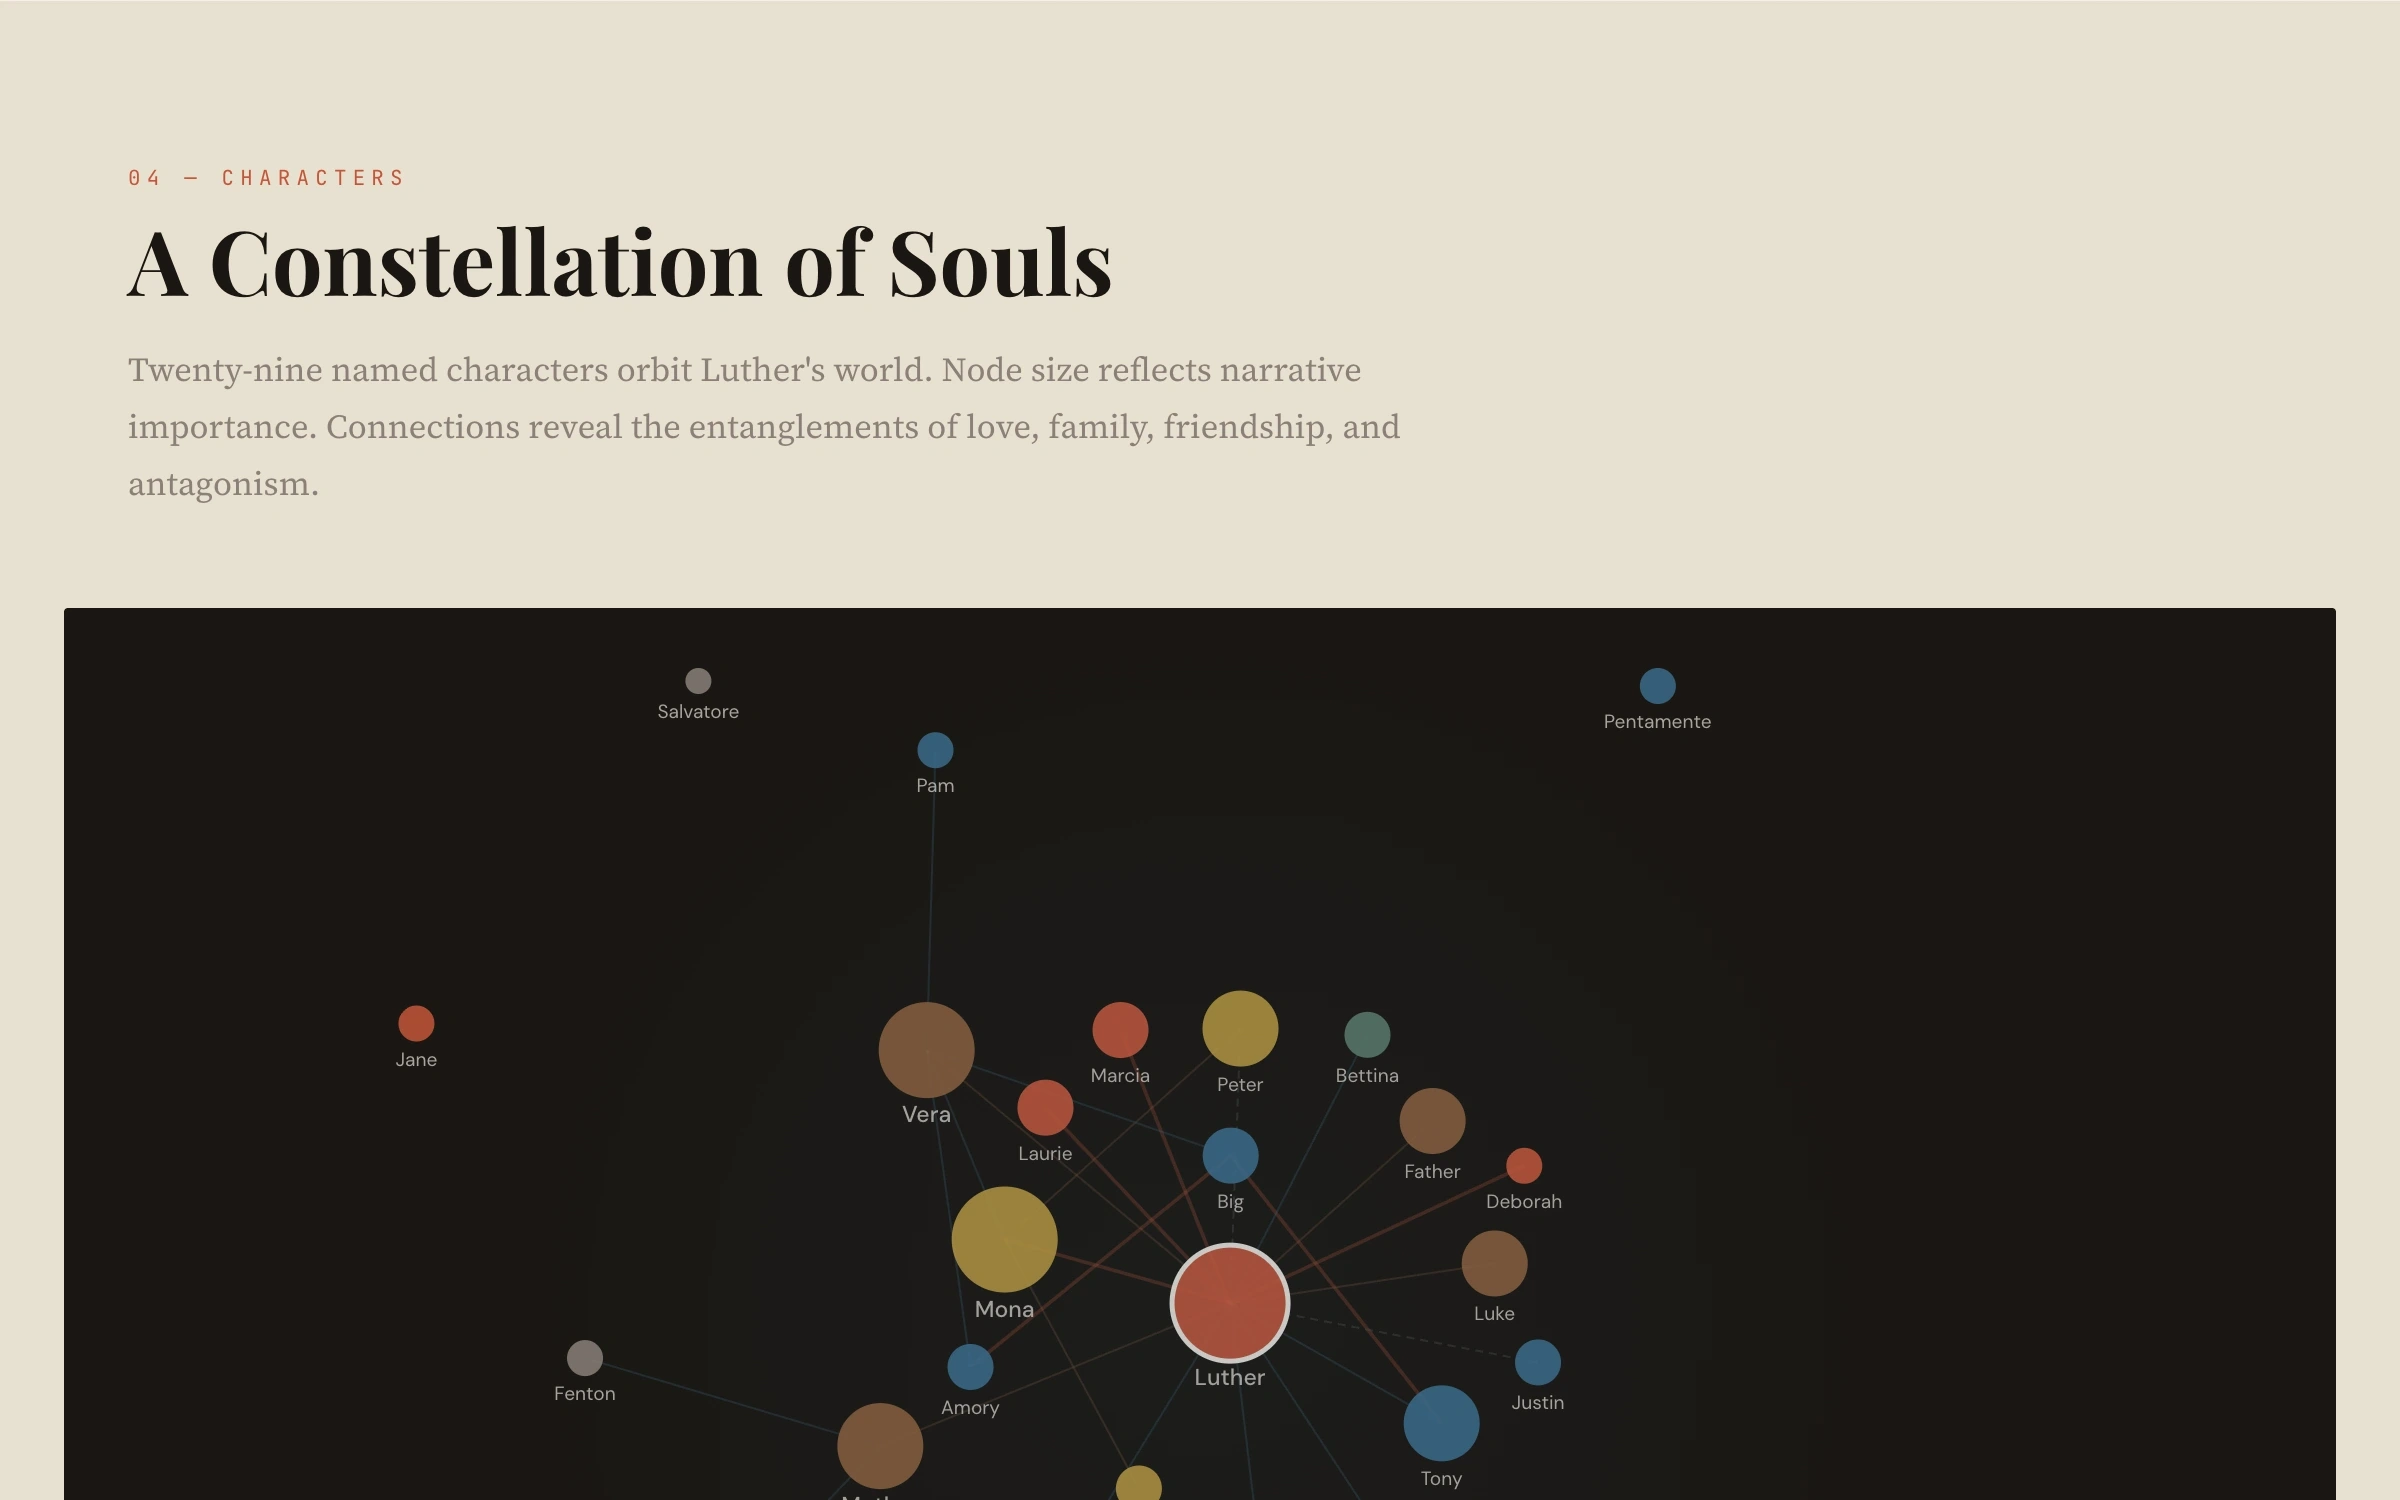
“A Constellation of Souls”: a network of the novel’s characters

05

Twenty-nine named characters orbit Luther. Node size follows narrative importance; the connections are love, family, friendship and antagonism.
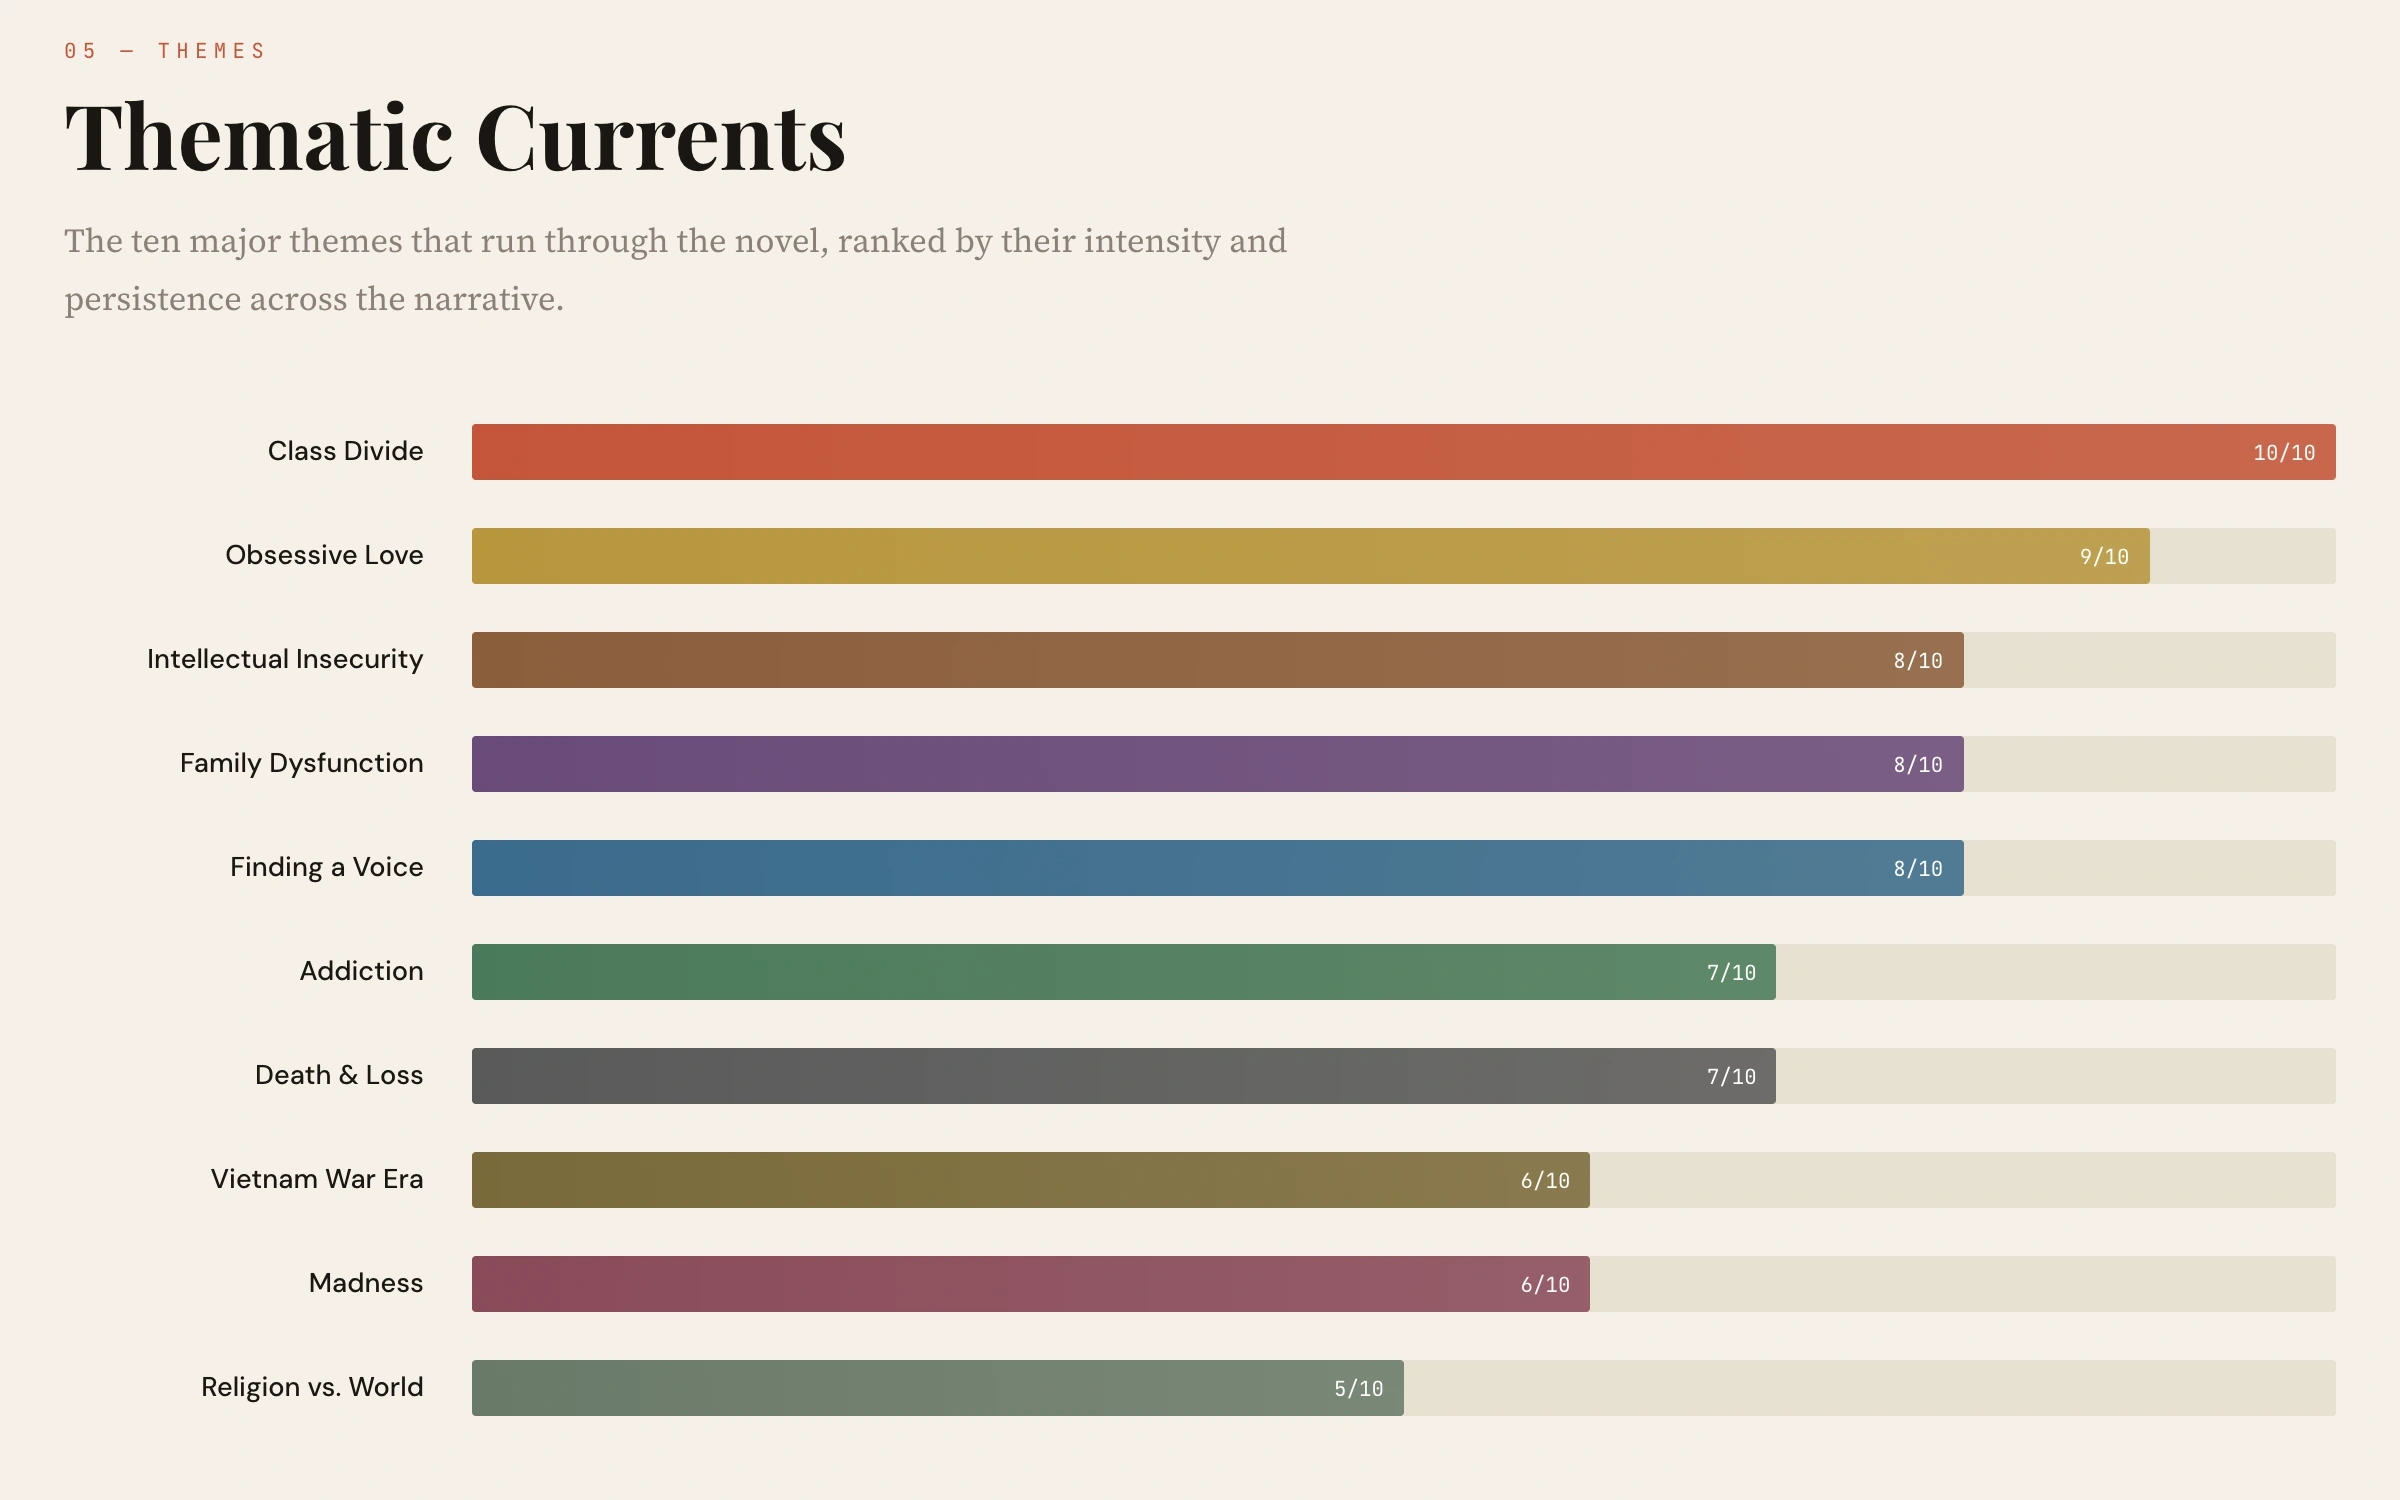
“Thematic Currents”: the novel’s themes ranked as bars
06The themes, ranked by intensity.
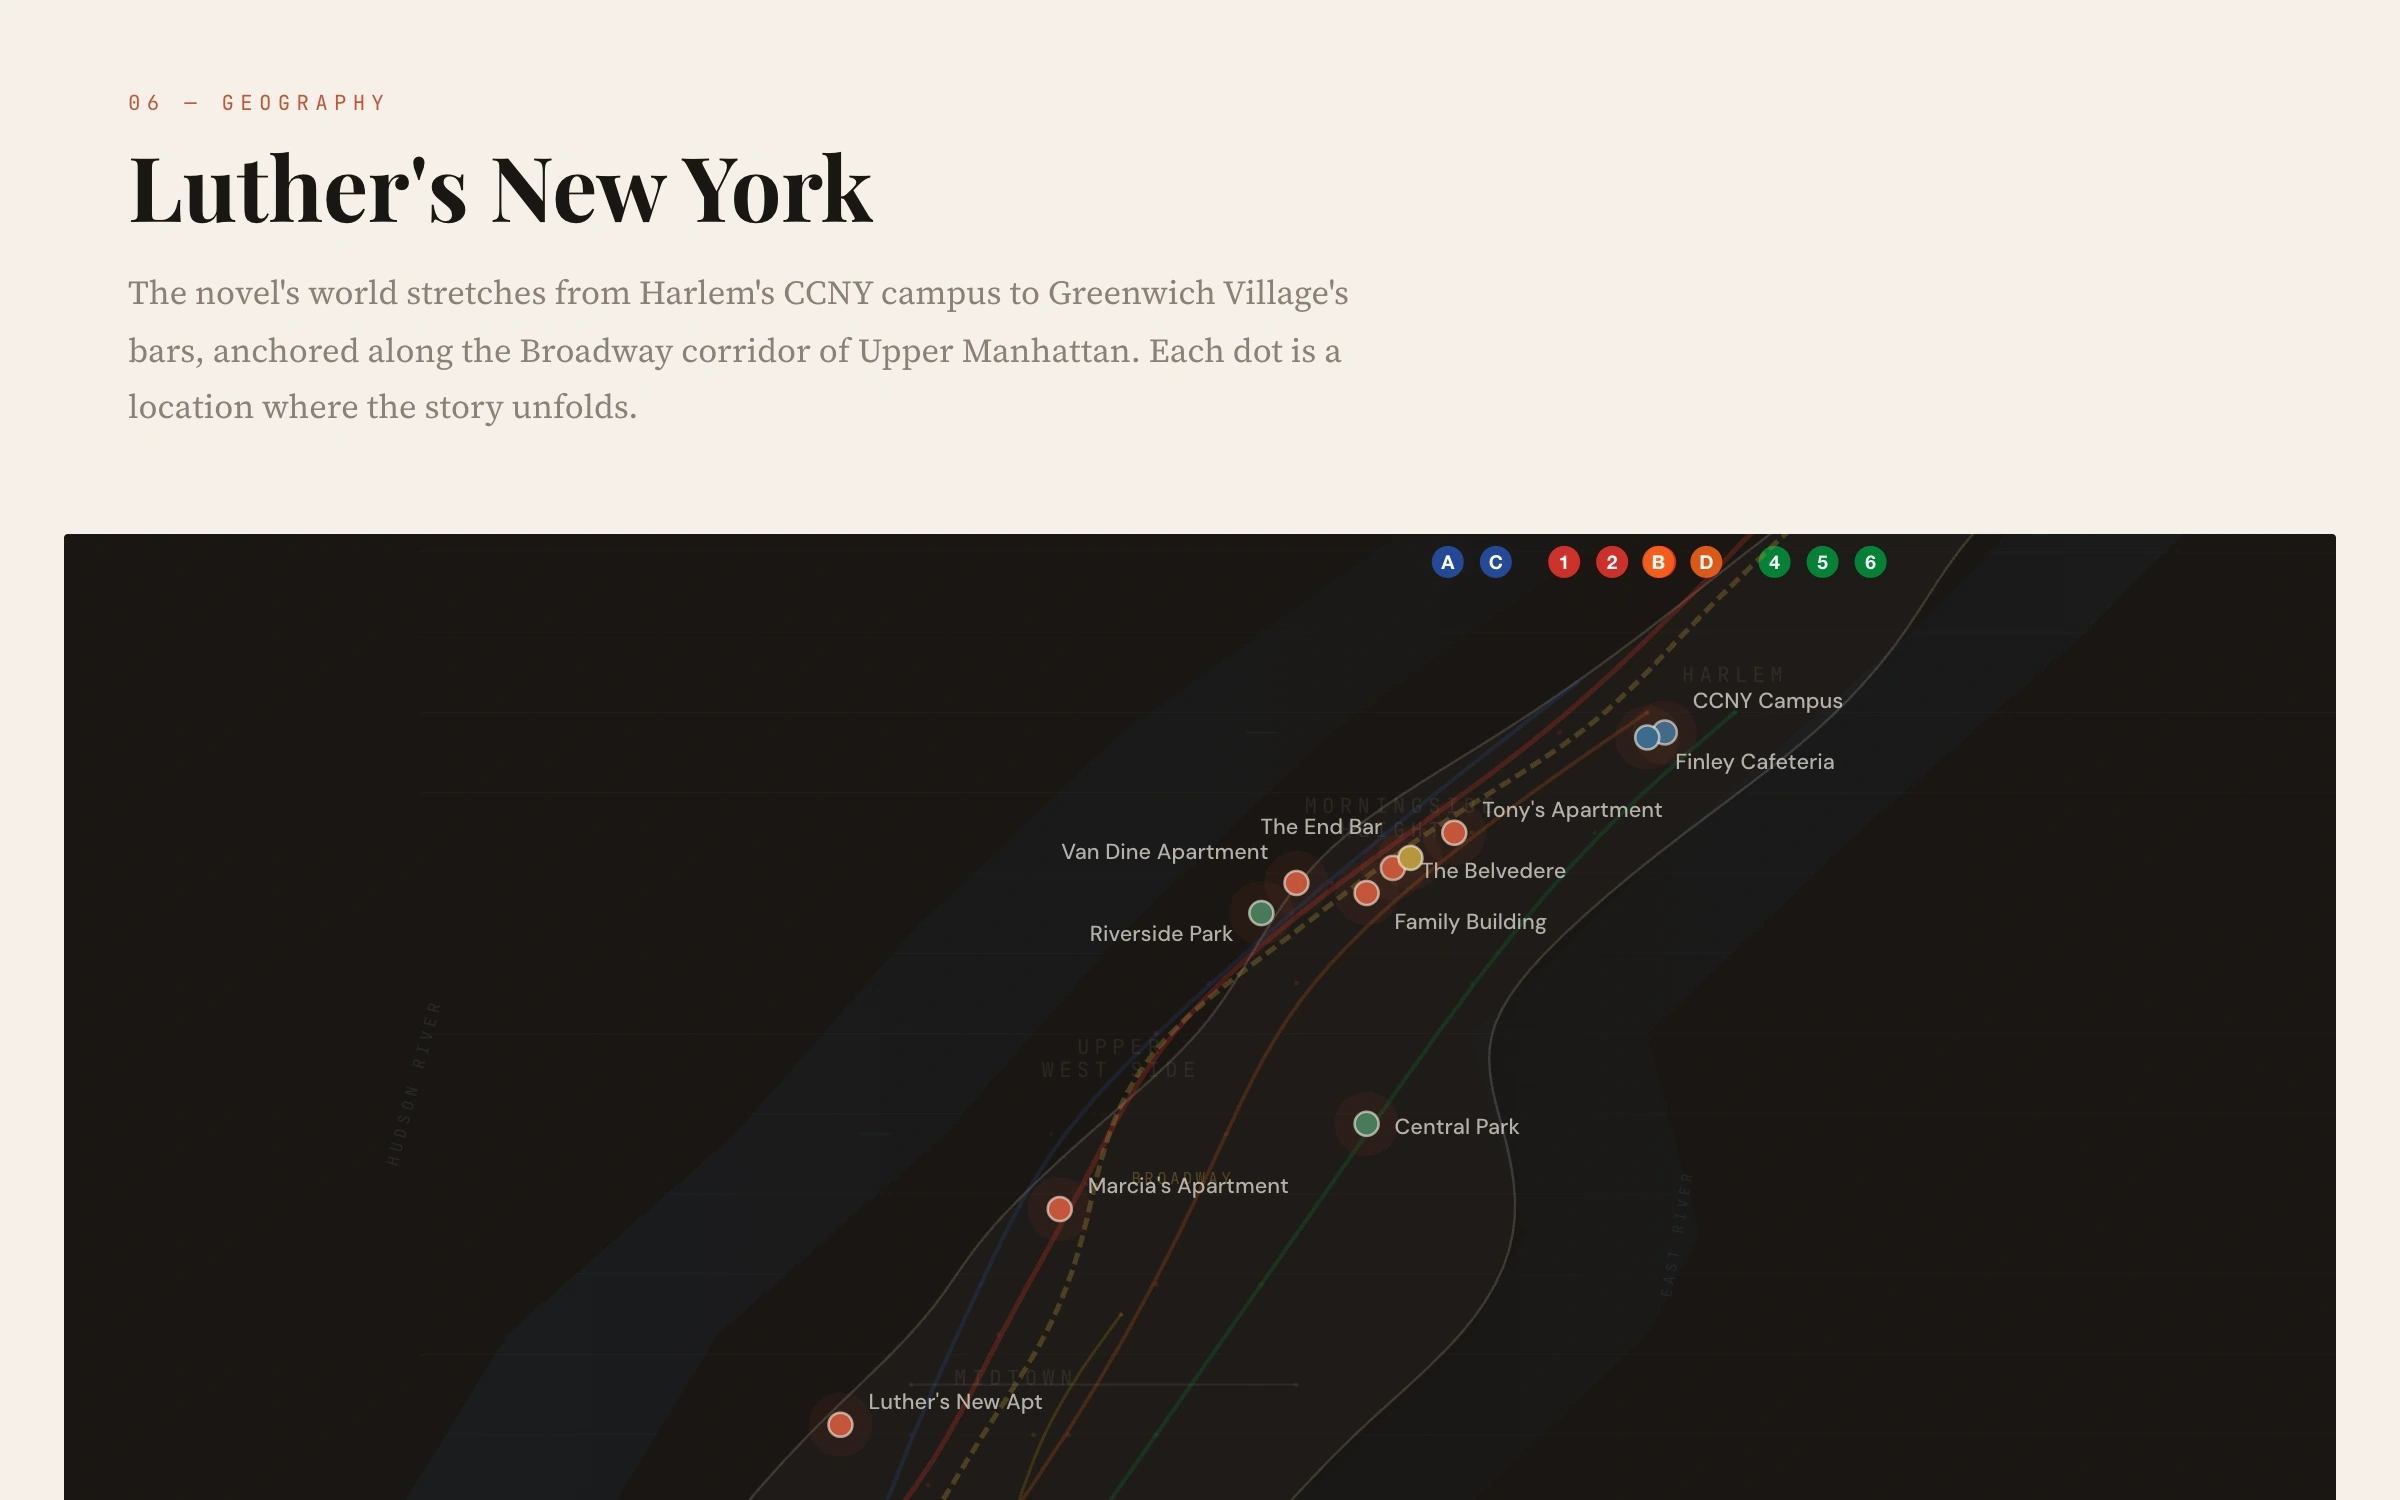
“Luther’s New York”: the novel’s places on a dark map of the city
07The book’s New York, with its places on the map.
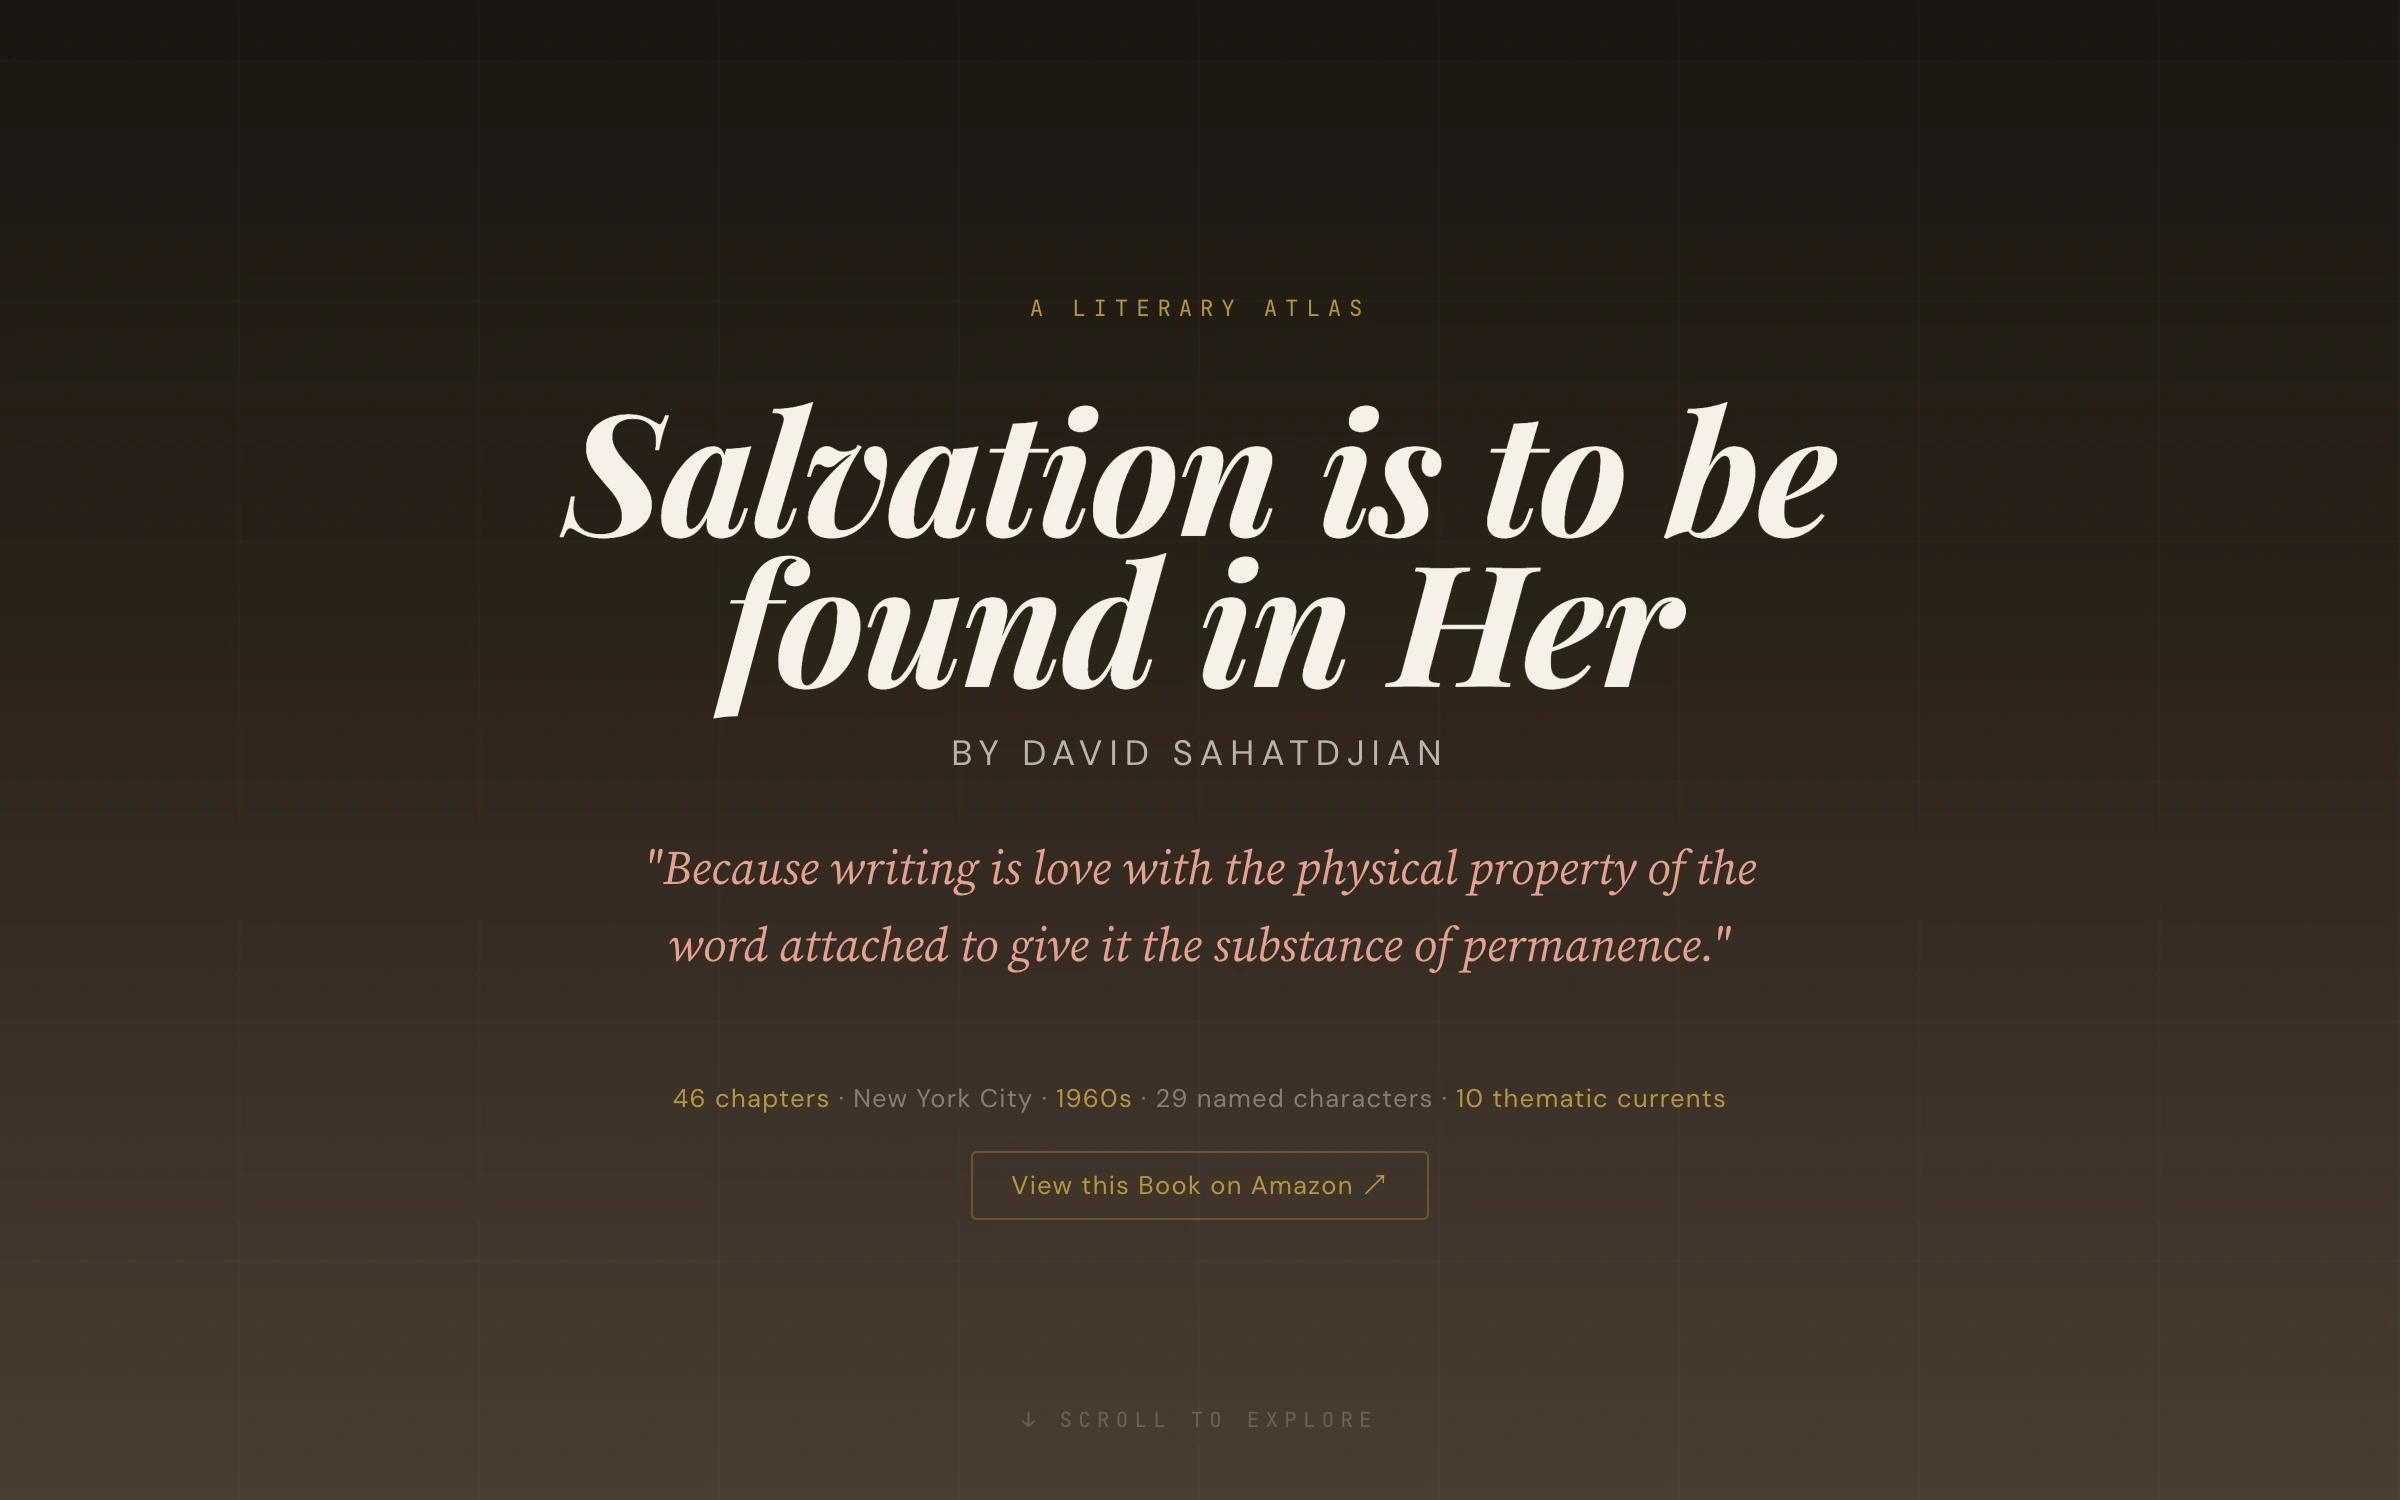
Salvation Atlas: “Salvation is to be found in Her” on dark ground
08Where the atlas begins: the book’s title and a line from it.

Your project

Have something like this in mind?

One decision-maker for strategy, design and engineering. Replies within 24 hours.

Get a quote
Expatly 360Next case study